
Why should your company implement Power BI?
Consistent metrics, less repetitive reporting and a clearer view of your business. What Power BI can change, and how DataStudio helps you put it to work.
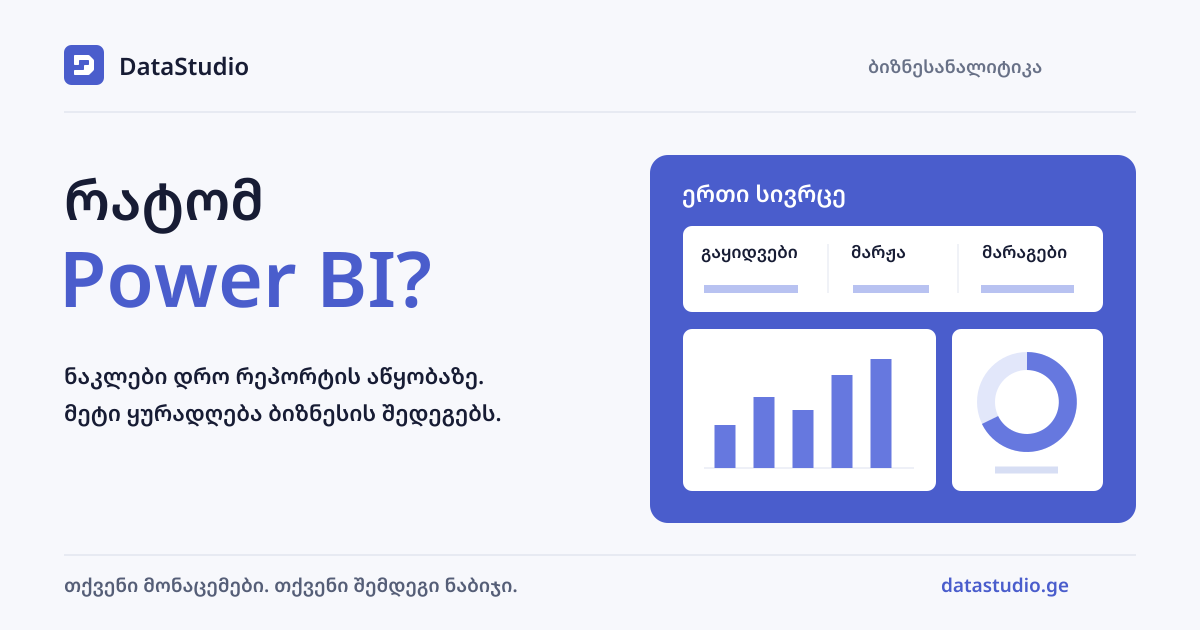
You have the data. How easy is it to get an answer?
A monthly review often starts with straightforward questions: which part of the business is growing, where are margins falling, and which products are tying up stock? Getting an answer may still mean opening several files, reconciling totals and preparing another spreadsheet.
Power BI becomes useful when these questions recur. A well-designed report presents metrics calculated using agreed rules and lets the team explore a result by product, branch or period. Access to information becomes easier; business decisions still belong to the people who understand the company.
One report, consistent definitions
Sales may live in an accounting system, targets in Excel and product attributes in another table. Power BI can connect these sources and use them in a shared model.
Implementation also means agreeing on definitions: whether sales include returns, which costs belong in margin, and which period a target covers. That work creates a reliable foundation. The team can spend less time discussing numbers calculated under different rules and more time discussing the results.
Less repetitive preparation
If someone combines the same files and checks the same formulas every week, making that process repeatable has practical value. Data preparation and refresh can be configured in advance, so each reporting cycle does not begin from scratch.
Refresh frequency depends on the source, access and technical setup. Not every report is real-time. Agreeing on an update schedule and displaying the last refresh time helps people understand how current their information is.
Look beyond the headline total
Imagine sales have grown but profit has not. A revenue chart alone will not explain the difference. A useful report lets you compare product categories, discounts, costs and branches to identify where the change occurred.
The same approach applies to inventory, receivables and performance against a plan. The report should answer specific working questions and help its users decide what to investigate or do next.
Information the team can use
A director may need the company-wide picture, a sales manager their own business area, and the operations team daily detail. Implementation should establish who sees what and how each person will use the report.
Internal sharing needs the appropriate accounts, permissions and licenses. The publicly accessible examples in DataStudio’s portfolio serve a separate demonstration purpose; they are not a template for sharing confidential company information.
Explore DataStudio’s work for yourself
When choosing a partner, it helps to see what the team actually builds. DataStudio’s public portfolio contains report examples for eight companies, including Silk Hospitality, Caucasus Auto Import, Château Mukhrani and HB Pharma.
You can also explore work for Rustavoil, Marussia Georgia, New Realty Group and Ghealth. Each project page opens an interactive report, allowing you to move between its pages and see how the information is organized.
These examples offer a practical view of DataStudio’s experience across different businesses. Your own project should start with your company’s questions, data and priorities.
Start with a useful first project
You do not need to move all company reporting at once. Start with an area where obtaining an answer currently takes too much effort, such as sales and margin, stock control or performance against targets.
An initial discussion should settle four points:
- Which questions must the first report answer, and who will use it?
- Where is the required data, and who is responsible for its accuracy?
- Which metrics matter first, and how is each one calculated?
- How will we check the results and establish that the report is useful in everyday work?
Your company could be next
If you want your team to spend less time assembling reports and have useful information ready when it is needed, explore DataStudio’s projects and get in touch.
Tell us which business question is difficult to answer and where the relevant data lives. That is the starting point for deciding what to tackle first and how Power BI could help your company.
Be the next company to make everyday reporting easier. Contact us at datastudio.ge/contact or email info@datastudio.ge.