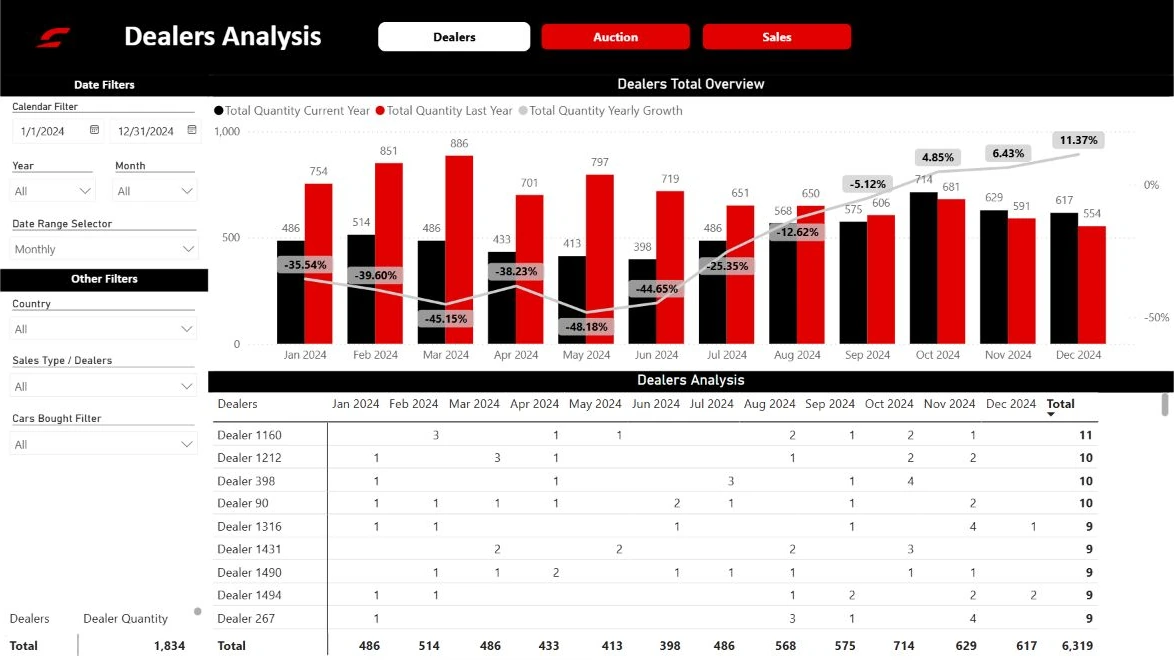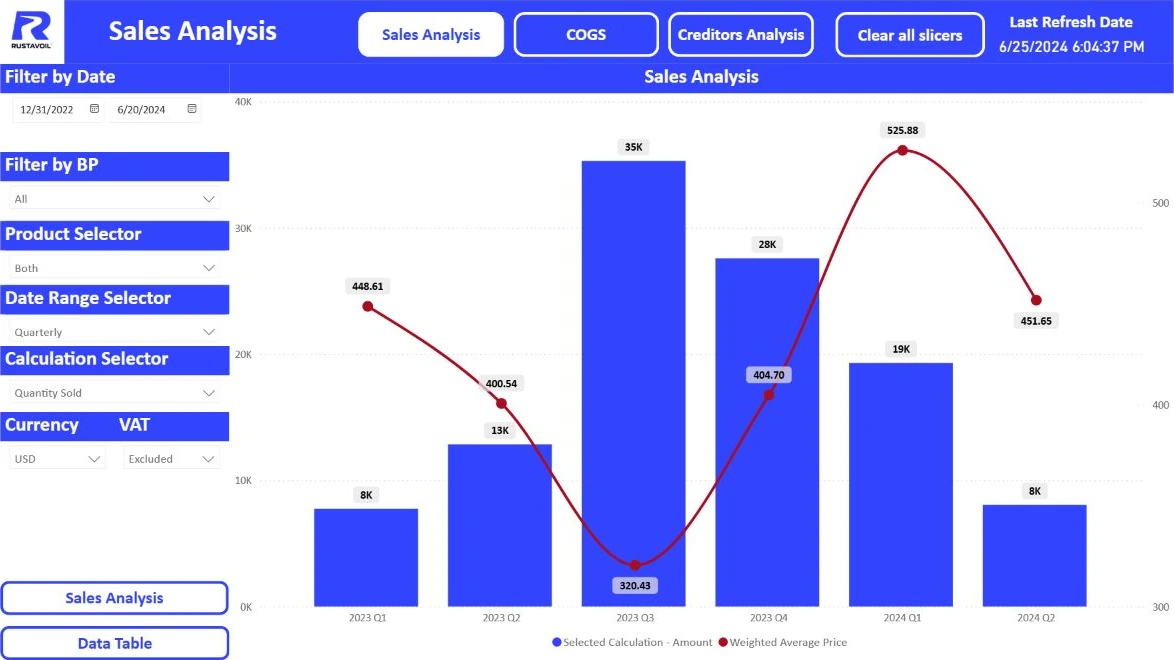

Week one: accept the result
Check the first real data refresh, not just whether the page opens. Reconcile control figures, verify user access and document known limitations. Identify who receives the issue if tomorrow’s data does not arrive.
Use one support channel and a short issue template: page, period, expected result and actual result. That turns “it does not work” into something the team can investigate.
Week two: practice actual work
Choose three everyday questions instead of demonstrating every button. For example: where are we behind target, which product changed and which transactions explain the gap? Let participants find the answers themselves.
If the report supports a weekly meeting, run the first meeting with it. The objective is independent task completion, not familiarity with the interface.
Week three: usage and friction
Where available, Power BI usage metrics can help you examine report views. Availability depends on permissions, licensing and administrator settings. A view is not proof of business value: someone can open a report and still fail to answer a question.
Combine usage information with short conversations. What was easy to find? What still required Excel? Which terms were unclear? Separate recurring obstacles from new feature requests.
Week four: focused changes and ownership
Choose a few changes that remove everyday friction: an unclear label, an unnecessary step or a missing detail. Adding every new request at once risks overloading the report again.
Compare the time needed for the same task before and after launch under similar conditions. Assign responsibility for data, the report and business definitions. When planning implementation with DataStudio, include this first month of use rather than treating file delivery as the finish line.
Put this into practice with your data
Tell us which reports you use and what you would like to improve. We will work out where to start together.
Tell us about your task