Keep three measures separate
Revenue, gross profit and gross margin percentage answer different questions. Here, gross profit means revenue minus the cost of goods sold. Gross margin is that difference divided by revenue. It is not net profit: other operating expenses have not been deducted.
Agree the definitions with the finance team before building the report. Returns, discounts and applicable taxes need consistent treatment on both sides of the comparison.
Growth can hide a decline
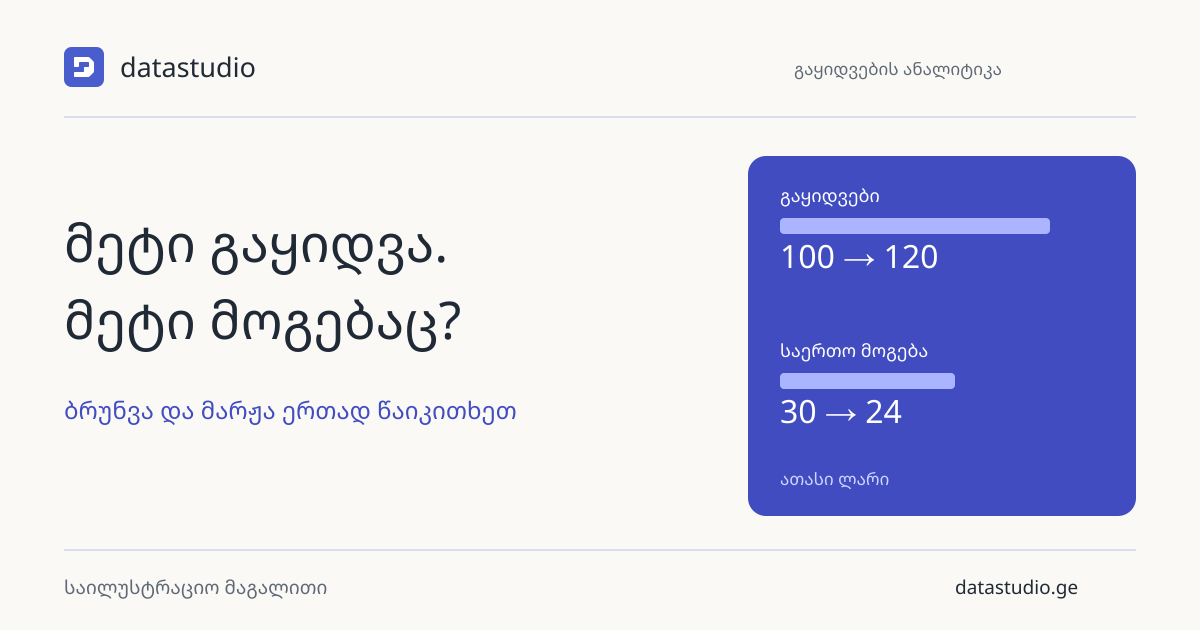
In an illustrative first period, revenue is GEL 100,000 and cost is 70,000. Gross profit is 30,000 and margin is 30%. In the second period, revenue reaches 120,000 but cost reaches 96,000. Gross profit is now 24,000 and margin is 20%.
Revenue rose 20%, while gross profit fell 20%. A revenue card alone hides that change. These are simplified invented figures, not a client outcome.
Locate the change
Compare product groups, branches and periods. Did lower-margin products become a larger share of sales? Did purchase prices change? Were discounts and returns recorded consistently? These questions guide investigation; a chart alone does not establish a cause.
Do not take a simple average of product margin percentages. Calculate overall margin from total gross profit divided by total revenue, so small and large product lines do not receive equal weight.
What to put in the report
Show revenue, cost, gross profit and margin together, with the change from the comparison period. Add product and branch breakdowns with a path to the underlying documents. Flag missing cost as an exception rather than assuming it is zero.
The report does not automatically prescribe a pricing decision. It identifies products and transactions worth investigating. If your current reporting shows only turnover, discuss the missing view with DataStudio.
Put this into practice with your data
Tell us which reports you use and what you would like to improve. We will work out where to start together.
Tell us about your task